Exploring New York City Council Meetings Data
If you haven’t noticed from my previous blog posts on New York City 311 complaints and webscraping legislation, I am a huge fan of using data to improve local politics and municipal policies. We often hear of data science in the context of training recommendation engines for behemoths like Amazon and Netflix, but with cities like New York pushing for open data, even a small-time data wrangler like myself can provide (hopefully) useful insights for my community.
So what lessons can be learned by exploring the rather inaccessible meetings data provided by the New York City Council Legislative Research Center? Let’s dive into the data!
Exploring Annual Trends
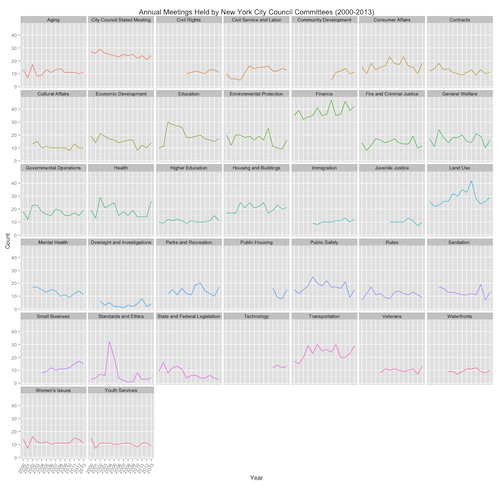
When I first started looking at the meetings data, I immediately wanted to know if there were any annual trends - how has the number of meetings held each year changed over time within each city council committee?
After a little cleaning and some fun with Hadley Wickham’s dplyr package and ggplot2 facets, we can generate an exploratory visualization to answer our question:

Interpreting the Graph
Let’s examine a few of the interesting features:
Finance. Wow, the Committee on Finance sure holds a lot of meetings each year! Since they are responsible for overseeing the budget process, this makes a lot of “cents” - follow the money and you’ll be sure to find council members willing to congregate.
Truncated Plots. A few of the plots are shorter than the rest - for example, the Committee on Technology and the Committee on Community Development only cover the last few years, suggesting that they have only been formed recently.
Land Use. The Committee on Land Use shows a clear trend upwards with respect to the number of meetings held each year. As New York City faces a shortage in affordable housing units, the approval process for commercial development projects becomes ever more difficult and may lend to this increase in calendared meetings.
City Council Stated. Every two weeks the New York City Council is supposed to meet for what is called the Stated Meeting to introduce and pass legislation. The flat line suggests that the frequency of meetings has remained relatively consistent over time.
The Unethical Spike
The spike in the number of meetings held by the Committee on Standards and Ethics in 2004, however, is by far the most glaring outlier. What exactly is going on here?
A little digging through the New York Times archive in 2004 for scandals reveals this little nugget of history in New York City politics:

So was this scandal responsible for the spike in our graph? A quick browse through the meeting details on Legistar confirms this to be true.
Caveats
- We consider the period from 2000 to 2013 because data was incomplete for the years 1999 (the earliest recorded meeting year for this dataset) and 2014.
- We removed deferred meetings to consider calendared meetings only.
- We removed subcommittees, special task forces, town halls, and inactive committees to capture the primary committees that are currently active.
TODO
- Continue adding features to the nycc-legistar repo
- Feed HTML from the .aspx framework into R to for real-time updates
- Text analysis of the meeting topics
- Proportion of meetings deferred by committee