NYC Playgrounds by Neighborhood
If you’ve never found yourself wishing to be young again, New York City will certainly change that. With access to over 1200+ recreational play areas chock-full of fun and interactive playthings, life is good for an NYC kid. Heck, some playgrounds are even equipped with spinning water wheels, climbing walls, and giant building blocks. Jealous yet? Well, you should be.
But is life good for every NYC kid?
According to the Park Department’s website, the agency has “worked hard to provide play spaces that match the developmental needs and diversional demands of New York’s youngest residents and visitors.” Given this information, the (Sim) city planner in me became curious: are playgrounds allocated to neighborhoods in a way that reflects the population of children in that neighborhood? Or is there perhaps another mechanism for deciding where playgrounds should go?
Let’s answer these questions with some data.
Playgrounds Per 1K Children
To make it possible to compare the number of playgrounds between neighborhoods on a map, we have to standardize the count by the resident population. Thanks to OpenData, we can use the Neighborhood Tabulation Area (NTA) to get this information. However, since playgrounds are not typically intended for all ages (I don’t usually see newborns or grandmas playing on swing sets), I chose to standardize using the estimated population of the target audience - children ages 3 to 11 years old - to make our comparison metric more interpretable.
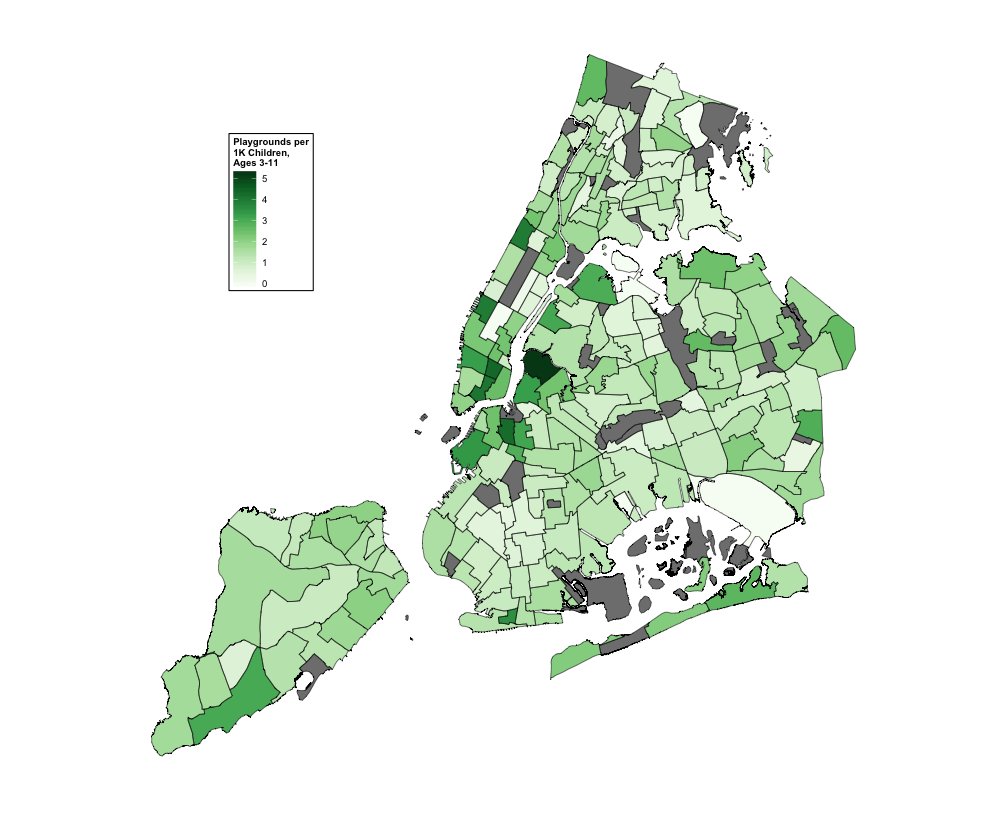
That led me to this map of the city:
 </img>
If the distribution of playgrounds in NYC were based on the population of children, we expect the playground metric used above to have minimum variation. Graphically speaking, the shade of green should be fairly uniform across neighborhoods. However, from this map, we can that there are clear clusters of neighborhoods with high and low playground densities.
Note that there are a few caveats to keep in mind. For one, NTAs are aggregations of population estimates at the census tract level. I do not take into account margin of errors here. Second, regions with little to no residents, such as parks and cemetery spaces, were not included in the calculations and appear on the map as gray areas. As such, a neighborhood’s proximity to a park may affect the interpretation of the results. For example, let’s say neighborhoods around Central Park have relatively low numbers of playgrounds per children. However, given the copious amount of playgrounds located within the nearby super-park, I wouldn’t be so quick to call these neighborhoods “playground deserts.”
Median Household Income
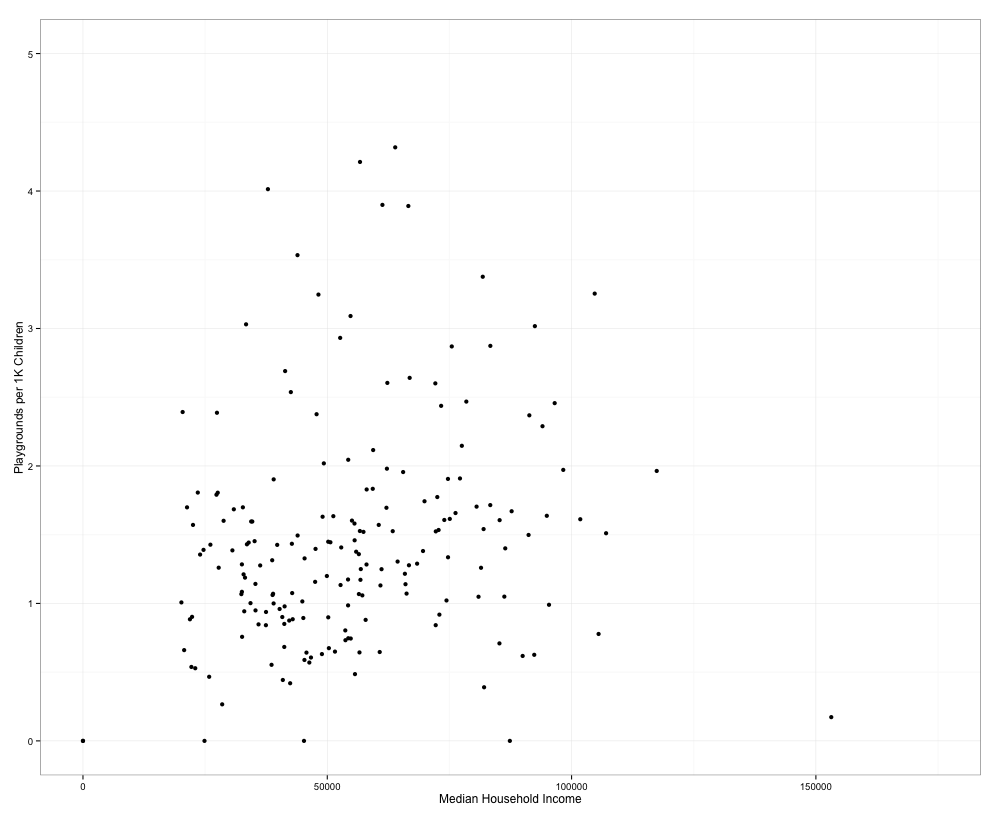
Okay, so if playgrounds aren’t distributed with respect to the population of children living in each neighborhood, how exactly are they distributed? Maybe it has to do with how rich or poor a neighborhood is?
 </img>
Not quite. The median household income and the playgrounds per children rate has a weak correlation of only 0.196. However, considering the many confounding factors in this relationship, this statistic should be taken with a grain of salt. As the author of this peer-reviewed study explains, “while parks may be equitably distributed across neighborhoods, the quality of the parks may be highly variable.” The same logic an be applied for playgrounds - in order to overcome the limitation of these analyses, we simply need more and better data.
Neighborhoods with the Most Playgrounds Per 1K Children
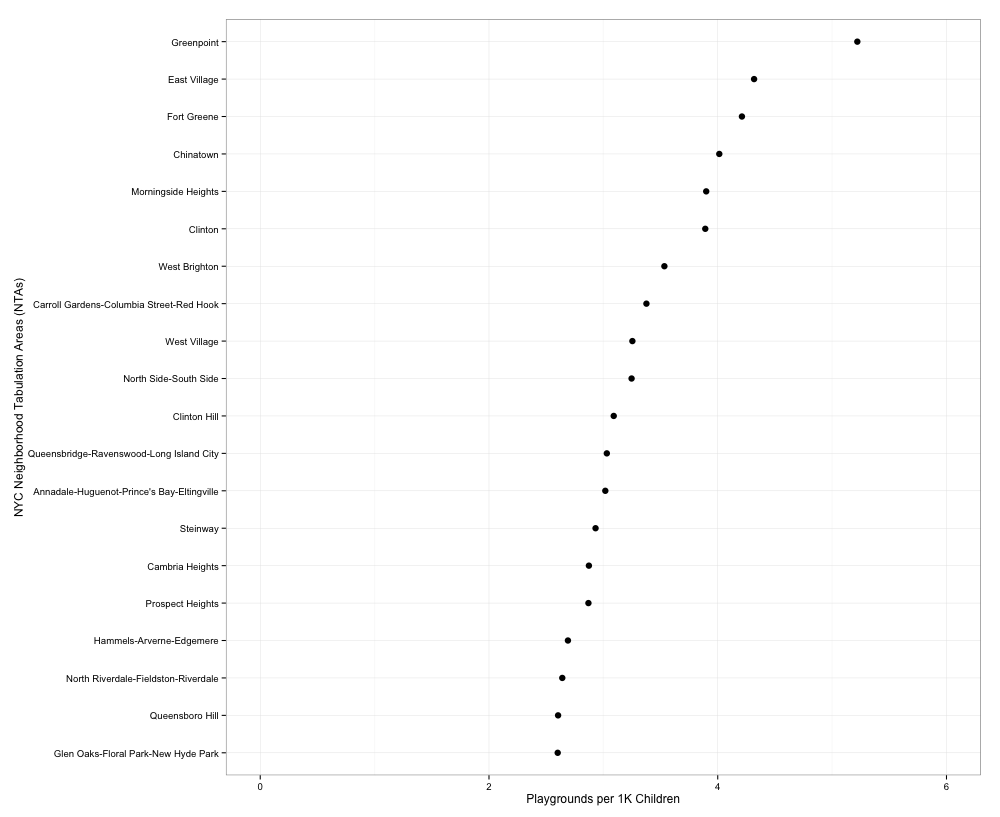
Alright, now that you have an idea of some of the assumptions I made in this quick analysis, let’s end this post with the juicy stuff - which neighborhoods dominate the playground market?
 </img>
Interesting. There appears to be the most playgrounds per children in Lower Manhattan and North Brooklyn - popular tourist areas. Perhaps the Park Department is catering more towards the demand of New York’s youngest visitors rather its residents?
Neighborhoods with the Least Playgrounds Per 1K Children
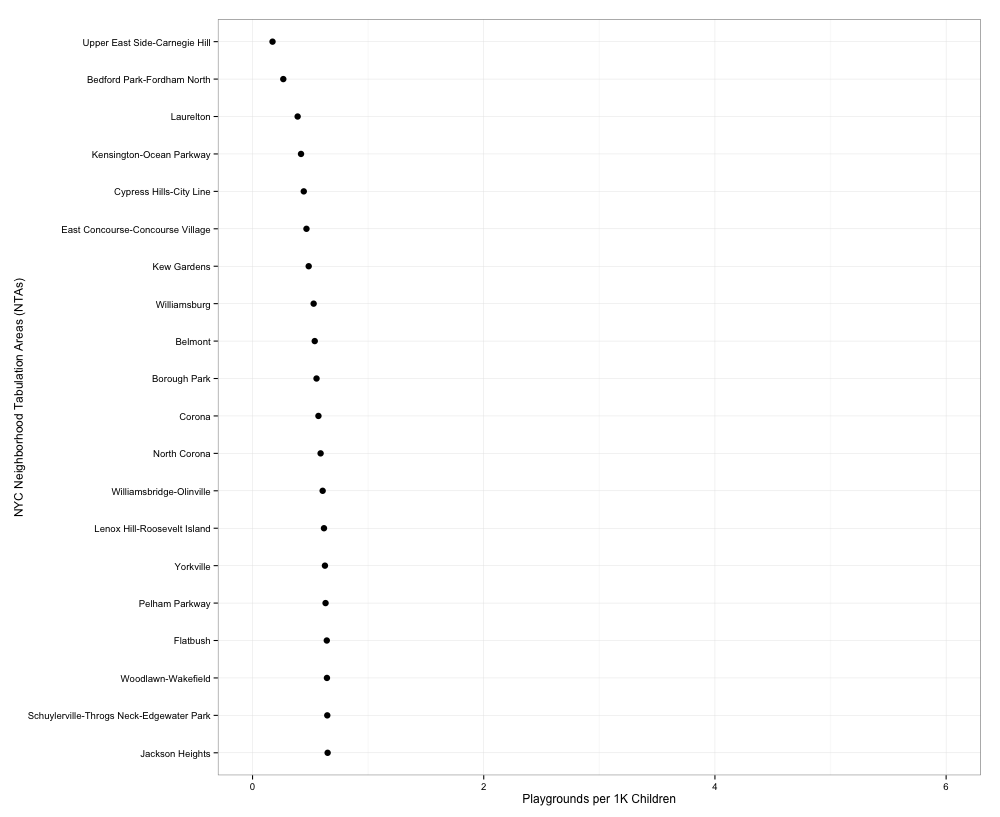
Now let’s see which neighborhoods rank in the bottom:
 </img>
Excluding the neighborhoods that are located near park areas, perhaps this list can serve as a starting point for city planners looking to develop new playgrounds.
Resources
As there are many more questions to explore, I encourage you to check out the data for yourself. To get you started, I published a GitHub repo with all the public datasets and scripts needed to replicate the charts above (and then some). You can also download the datasets piecemeal via the links below:
NYC Planning
OpenData.City
NYC Parks
Big thanks to Ben Wellington from IQuantNY for providing inspiration and to NYC Open Data for making this all this work possible within a weekend!