NYC Open Data Presentation
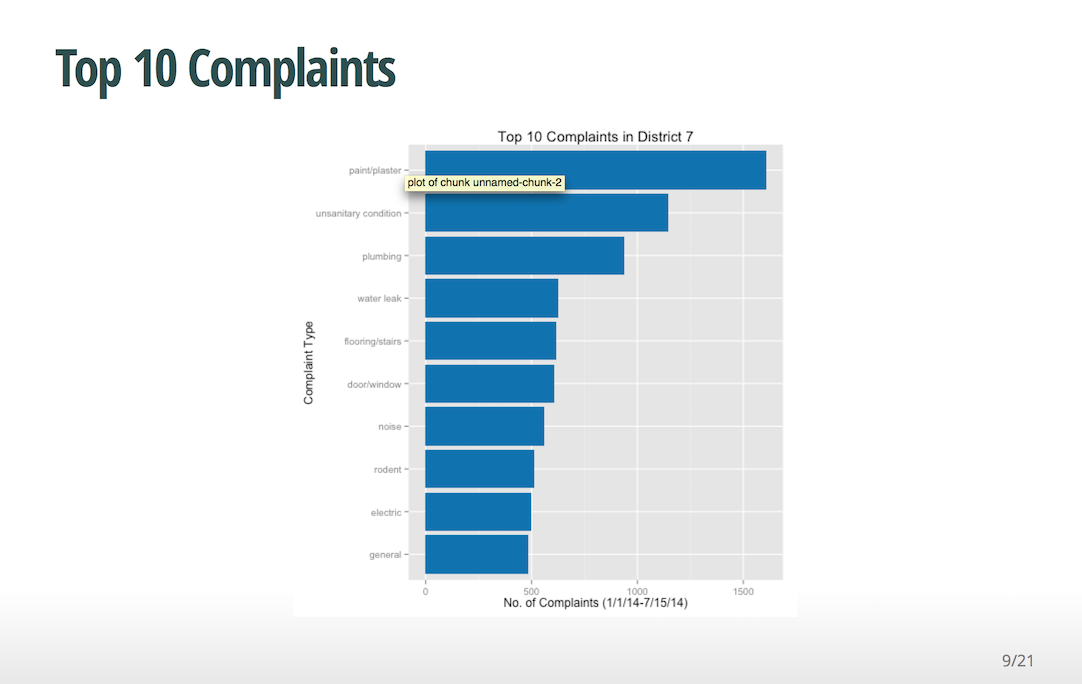
Back in October, I gave a brief presentation on the benefits of NYC Open Data for tracking issues on a district-level. This was primarily motivated from my work at the New York City Council and will be the basis of my MPH thesis, in which I will be creating a knowledge management system to quantify and visualize the 311 data for better communication in the policy arena.
However, what I wanted to share with everyone in this post is the idea of reproducible slides using slidify. I wrote the slides entirely in R and the plots were generated using R’s ggplot2 library.
The motivation behind this was being able to host my slides on github and push new updates and changes as I received feedback during my presentations.
Check it out by following the links below: