Sleep Data Analysis with R
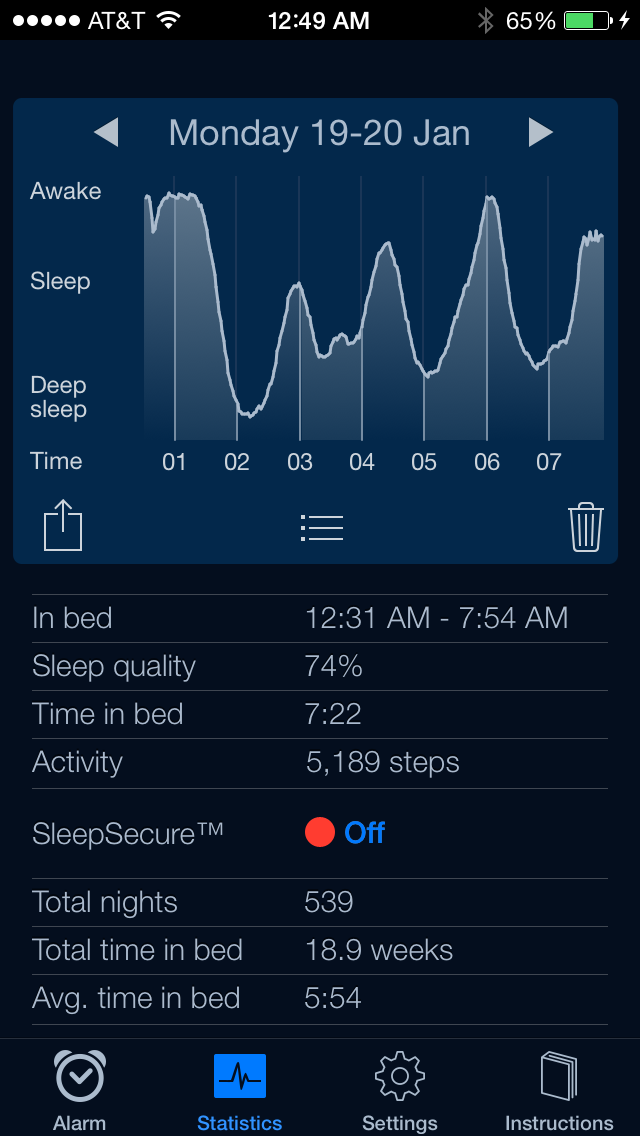
I have been keeping track of my sleep for over two years using the Sleep Cycle app for the iPhone. I initially downloaded the app for its smart alarm feature, which promises to wake you up without feeling tired (every person’s dream). The app allegedly achieves this feat by triggering the alarm when you are in light sleep, which is determined by the detection of your movements in bed. When you are finally able to wake up, you are treated to a nice summary of last night’s slumber:
 </img>
Clearly, I had trouble sleeping that night.
But what’s even more interesting is the ability to export data for each night of sleep. While Sleep Cycle does not (yet) allow the user to have access to fine-grained data like movement at various time intervals, we can still get the time we went to bed, the time we woke up, sleep quality, wake up mood, resting heart rate, and more. Since I have been using this app for quite some time, I am fortunate enough to have collected over 500 data points. This makes it easy for a quantified selfer like myself to conduct his own sleep analysis.
That being said, let’s fire up R and and answer some questions with ggplot2!
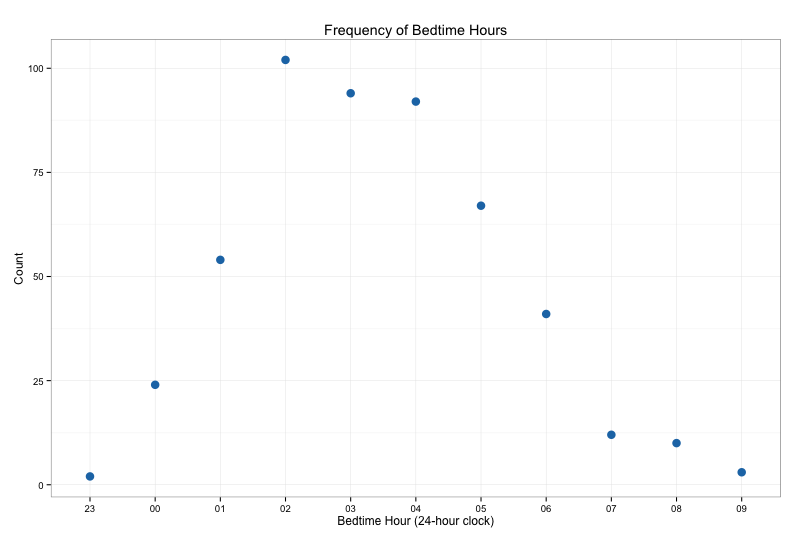
Bedtime Hours
The first thing I wanted to know right off the bat was the most common hours I went to bed. Taking a rule from Tufte’s visualization philosophy, I made sure to keep my data-to-ink ratio low since I’m only plotting one piece of information.
 </img>
Clearly, I should be sleeping earlier. According to this graph, the most common hour I fall asleep is 2 in the morning. However, I should be mindful of bias since I am less likely to initialize the Sleep Cycle app when I’m super tired - as is often the case when I fall asleep before midnight.
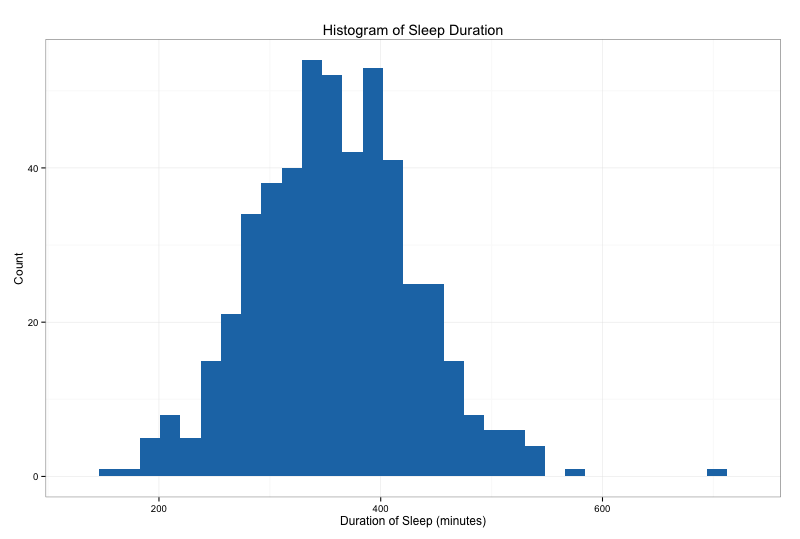
Sleep Duration
Next up on this sleep analysis journey is determining how often I slept for when I did fall asleep. This can be answered with a simple histogram:
 </img>
An approximately normal distribution as expected with the large sample size. On average, I slept about 355 minutes, or 5 hours and 55 minutes per night. Take note that the mean is pulled up by an outlier, the result of a 12 hour hibernation on a warm summer night last year.
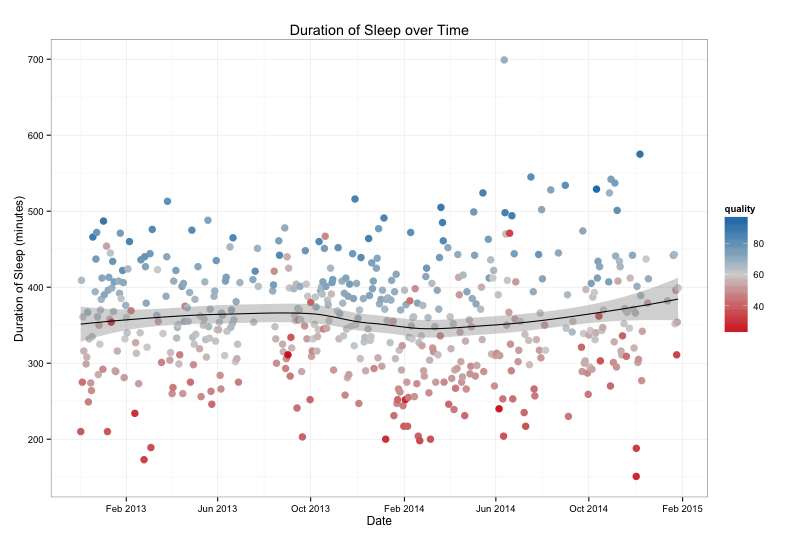
Sleep Duration Over Time
How has the duration of my sleep changed over the past two years? One interesting note I should mention is that I moved from Berkeley, CA to New York, NY in August 2013 for grad school. Did this change of environment affect my sleep in any way? Let’s check it out:
 </img>
Interesting. To make the graph more interpretable, I fitted a LOESS curve through the data so we can see how my average sleep duration changed over time. According to this visualization, I appeared to adjust well to the notoriously loud New York City. However, during the months of November and December of 2013, my average sleep duration dropped. This trend may be the result of finals season taking over my life. Since then, however, I’ve been on a mission to repair my sleep schedule.
Sleep Quality Over Time
In the graph above, red dots indicated “poor” sleep quality whereas blue dots indicated “good” sleep quality. The cutoff between poor and good was made at 60%, the median of all sleep quality values.
But what the heck is this “sleep quality” variable even about?
According to the Sleep Cycle FAQ, this metric is affected by two factors:
- Total time asleep
- Amount of movement
Since we don’t have access to the movement data, we can’t verify the relationship between movement and sleep quality. However, we can check to see if there is a linear relationship between sleep duration and sleep quality:
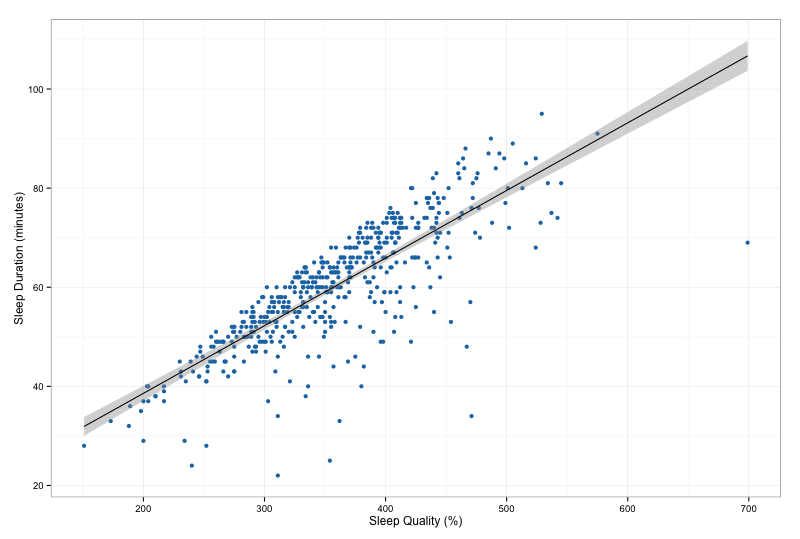 </img>
Given this information, it is possible for sleep quality to increase even when sleep duration decreases, especially if I’m moving around less in bed. So perhaps even though I’m sleeping for shorter durations in NYC, I’m getting better sleep overall. Let’s plot sleep quality over time to find out if this is true:
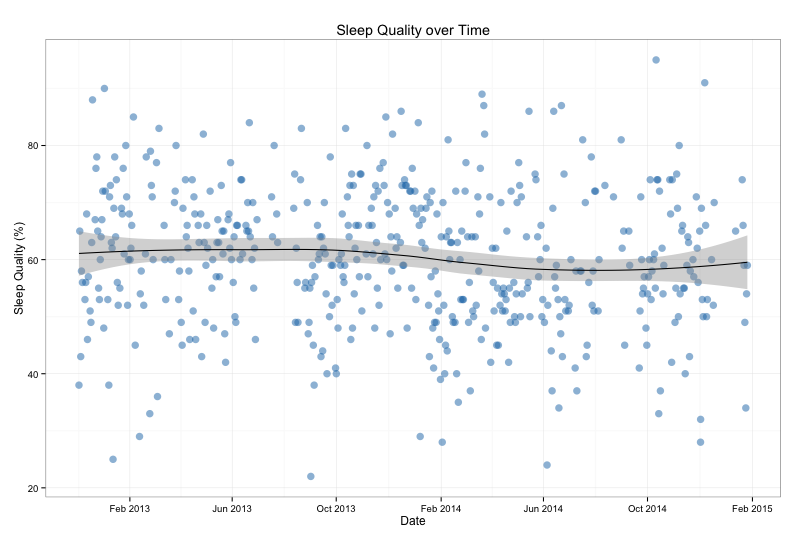 </img>
Notice how the LOESS curve is similar to the LOESS curve in the graph depicting sleep duration over time. So maybe I’m sleeping more peacefully, but sleep duration is heavily weighted in Sleep Cycle’s sleep quality formula. Or maybe my movements in bed are fairly consistent and I just need to sleep for longer periods.
Probably the latter.
Resources
If you want to play around with sleep data, but don’t have the Sleep Cycle app, I published a GitHub repo with a sample dataset and the R code I used to generate these graphs. You can also download the dataset and use the Gist below for your convenience. Happy self-quantifying!
Download the sleep data here.